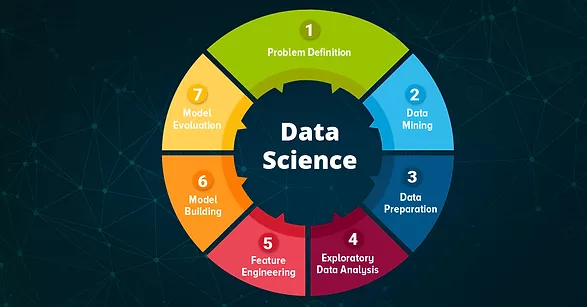
Why EDA is important for any business problem?

Exploratory data analysis is one of the best practices used in data science today. EDA is all about using statistical modeling and visualization techniques to reform the available data. The reformation is carried out to filter out essential aspects of that data for further analysis.
At an advanced level, EDA involves looking at and describing the data set from different angles and then summarizing it. Today, this data pre-processing step is an essential one before starting statistical modeling or machine learning engines to ensure the correctness and effectiveness of data used.
John Turkey first developed and presented exploratory data analysis in the 1970s. It was limited to research papers only for a long while. In the last decade, however, it gained more visibility as a best practice philosophy. Today many data analytics consulting firms use EDA as a must-have pre-processing step for machine learning solutions.
A simple, practical EDA example
Let’s consider you are using EDA on a problem to determine the number of shoe types a person is likely to buy. In the raw data collected, it was evident that usually, people buy three kinds of shoes per year, and a small group of people buys 10 or 15 types of shoes per year.
Only the use of EDA will help spot the group that purchases more than 10 or 15 types of shoes. Hence, EDA helps to focus on these minute details and supports the next stages of data analysis in considering these details.
Five things that EDA helps data scientists to do better
- Get a better understanding of data
EDA helps to bring out points from datasets that may not be analyzed by standard data science algorithms. EDA helps in better data understanding.
- Understanding data patterns
EDA is known for capturing and analyzing uncommon data patterns that will be skipped by typical machine learning algorithms.
- Drawing charts and graphs for better understanding
EDA is all about data visualization. EDA analyzes data sets from different angles and projects the results as charts and graphs.
- To get a better understanding of the problem statement
With graphs and charts and other forms of data visualization using ML, EDA gives a sound picture of the problem.
Some good EDA and data pre-processing practices
- Have a well-defined problem statement
It is always advised to have a clear goal and not add items to it. In data science terms, “controlled exploration yields best results.”
- Level the data set and re-iterate
When EDA reveals interesting findings and patterns that are not related to the original problem statement, do not get diverted. You can note it down for later use but immediately return to the initial exploration.
Conclusion
The pre-processing step of EDA not only makes the entire machine learning data analytics process easier but also leads to better results. Hence, it is highly recommended that data scientists use it if they aren’t already.

